
If you work in pharmaceutical manufacturing, you already know your site prints a staggering amount of paper. But have you ever stopped to ask which documents are responsible for most of it?
We went looking for a published Pareto analysis of pharmaceutical GxP paper consumption — a simple breakdown of which document types generate the most printed pages at a typical manufacturing site. It doesn't exist. No industry body, consultancy, or regulator has published one.
So we built one ourselves, drawing on MES vendor case studies, ISPE Facility of the Year data, EY analyses, and practitioner accounts. The picture that emerged is striking — and if you're thinking about reducing paper at your site, it should change where you start.
The scale of the problem
A mid-sized pharmaceutical manufacturer — say 200 to 1,000 employees — prints somewhere between 2 and 10 million GxP pages per year. That's a wide range, and it reflects real differences in production volume, product complexity, and how far along the digitisation journey a site might be.
The most concrete benchmark comes from PCI Pharma Services, which references a mid-sized manufacturer consuming 10 million pages annually — enough to destroy over 1,200 trees and release more than 225 tonnes of CO₂ [1]. At the other end of the spectrum, Takeda's Lessines facility in Belgium (an ISPE Facility of the Year Award winner in 2023) documented eliminating roughly 300 pages per lot at its plasma therapeutics plant, totalling over 100,000 pages and 500 kg of paper annually — and that was a relatively focused, single-product-family operation [2].

The scale of pharmaceutical paper: a visual metaphor for the documentation burden at manufacturing sites.
The financial cost is just as real. An IDC and Adobe study found that time spent processing paper documents costs approximately $19,700 per worker per year [3][4]. At a 500-person site, that's roughly $10 million annually in documentation labour costs — before you count the paper, the printers, the storage, or the time spent retrieving archived records.
Two document types dominate everything
Here's the finding that surprised us — not because it's counterintuitive, but because of how extreme the concentration is.
Batch records account for roughly 40–50% of all GxP printed pages. When you add equipment logbooks, those two categories together consume an estimated 55–75% of total paper volume.
That's a Pareto distribution — and a lopsided one.
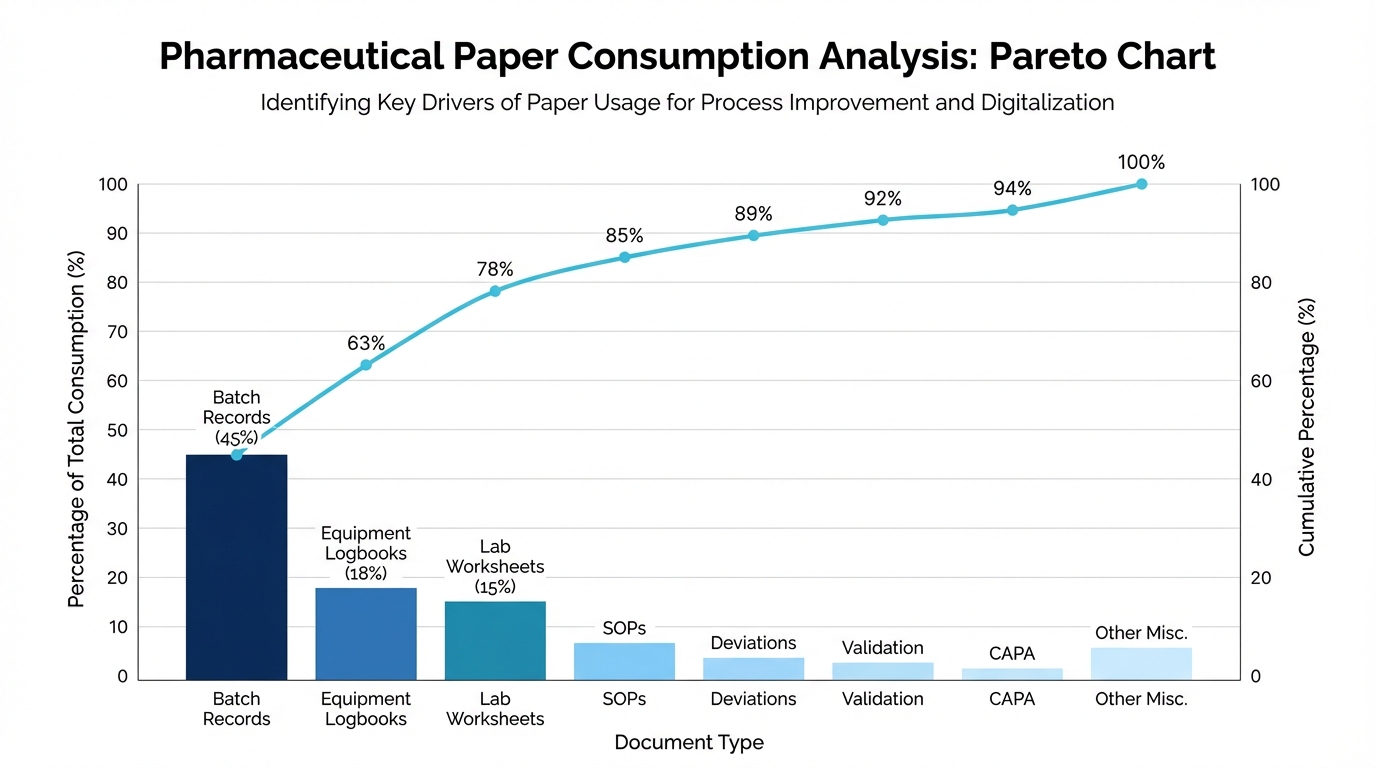
Pareto analysis of GxP paper consumption: batch records and logbooks together account for over 60% of total printed pages.
Why batch records are the heavyweight
Every source we reviewed — every vendor case study, every digital transformation report, every industry publication — points to batch production records as the dominant paper consumer. The maths explains why.
A typical batch record runs 100 to 200 pages for standard oral solid dosage manufacturing. Complex biologics reach 300+ pages. Personalised therapies like CAR-T can hit 400. EY uses 150 pages as a representative benchmark for a standard batch record [5]. Some batch records, as Qualio notes, "comprise thousands of pages entailing thousands of fields for a single production process" [6].
Now multiply by frequency. A mid-size site with multiple production and packaging lines runs 50 to 200 manufacturing batches per month, plus a comparable number of packaging runs. At 100–150 pages per manufacturing batch record and 20–60 pages per packaging record, the arithmetic yields 7,000 to 48,000 pages per month from batch and packaging records alone.
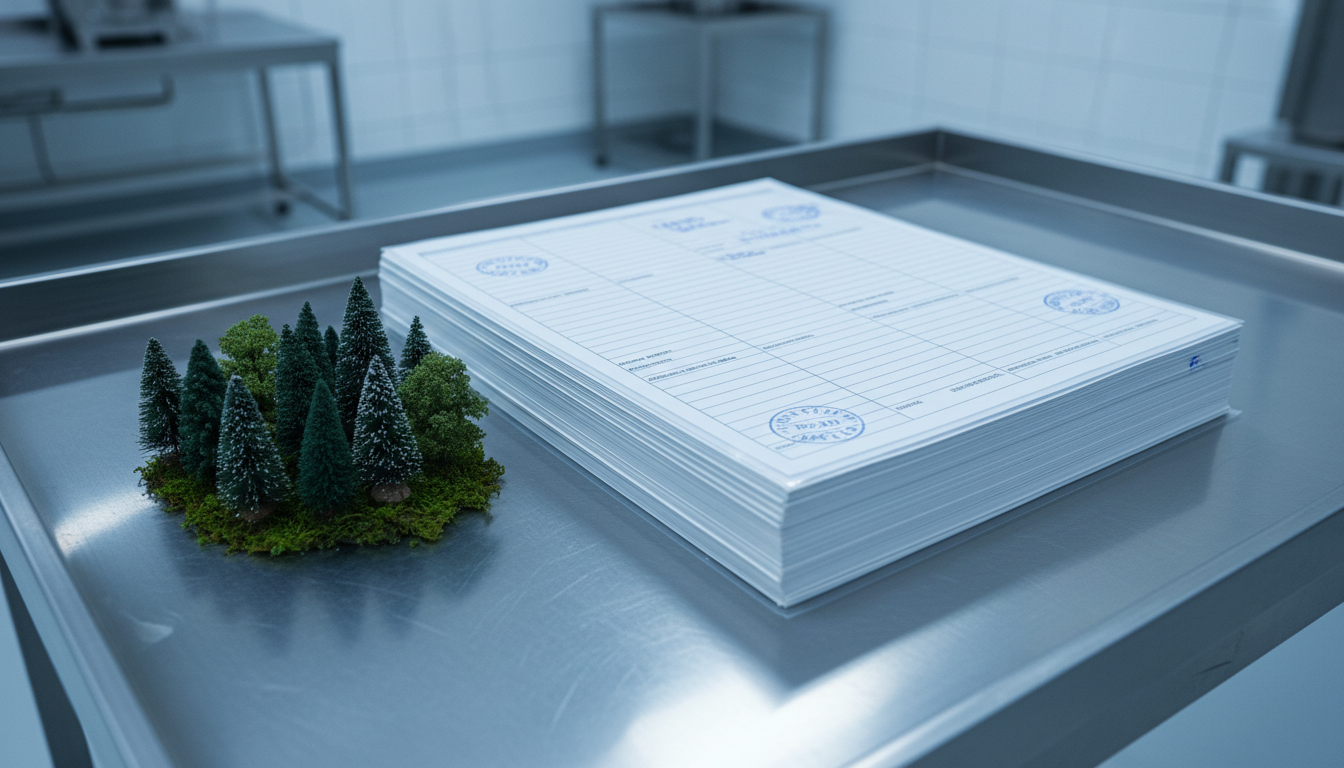
A single batch record can run 200+ pages. Multiply by hundreds of batches per year and the environmental impact becomes clear.
AGC Pharma Chemicals' Spanish plant — with just 150 employees — reported generating "thousands of paper batch records per year" requiring "hundreds of thousands of manual entries," with up to six different staff members revising each document [7].
Why logbooks add up fast
Equipment logbooks don't look like a major paper problem at first glance. Each entry is only 1–3 pages. But the frequency is relentless.
A single piece of major equipment might generate 3–5 logbook entries per day — usage logs, cleaning logs, calibration records, maintenance entries. A mid-size site with 50–100 major equipment pieces produces hundreds of entries per week. Add room and area logs, environmental monitoring records, and shift handover documentation, and logbooks collectively represent roughly 15–20% of total paper volume.
As one industry source from Caliber Technologies put it: "tons of paper logbooks bought and used every year."
The full picture: a long-tail distribution
To understand where all the paper goes, we estimated page counts and frequencies for every major GxP document type at a mid-size site. Here's what the distribution looks like:
| Document type | Pages per instance | Annual frequency | Est. annual pages |
|---|---|---|---|
| Batch production records | 100–200 | 600–2,400 batches | 60,000–480,000 |
| Packaging batch records | 20–60 | 600–3,000 runs | 12,000–180,000 |
| Equipment logbooks | 1–2 per entry | 6,000–24,000 entries | 6,000–48,000 |
| Laboratory worksheets | 3–10 per test | 5,000–15,000 tests | 15,000–150,000 |
| SOPs (controlled copies) | 5–20 per SOP | 800–1,500 active SOPs | 8,000–30,000 |
| Deviation reports | 3–15 | 1,000–1,500 | 3,000–22,500 |
| Environmental monitoring logs | 2–5 per session | 700–2,400 sessions | 1,400–12,000 |
| Validation protocols | 50–300 | 50–200 protocols | 2,500–60,000 |
| CAPA reports | 5–15 | 200–600 | 1,000–9,000 |
| Calibration records | 2–4 | 500–2,000 events | 1,000–8,000 |
| Change control records | 5–15 | 200–500 | 1,000–7,500 |
| Stability study records | 50–200 | 50–100 studies | 2,500–20,000 |
| Cleaning records | 1–3 per event | 2,400–9,600 events | 2,400–28,800 |
| Training records | 2–5 | Variable | 2,000–10,000 |
The pattern is clear. The top three categories — batch records, logbooks, and lab worksheets — account for roughly 70–80% of total printed pages. The remaining 8–10 document types share the balance.
It's not a clean 80/20 split. It's closer to 75/25. But the practical implication is the same: a small number of document types drive the vast majority of your paper consumption.
Why this matters: frequency × page count
The Pareto concentration emerges from the interaction of two variables — how thick a document is and how often you generate one.
Batch records sit at the extreme of both dimensions: high page count and high frequency. That's what makes them the undisputed heavyweight.
Logbooks work differently — low page count per entry, but extremely high frequency. The volume is death by a thousand cuts.
By contrast, validation protocols are thick documents (a PQ protocol can hit 300 pages) but generated infrequently — perhaps 50 to 200 per year at a steady-state site. Deviation reports are moderately frequent (industry surveys suggest 1,000–1,500 per site per year) but relatively brief at 3–15 pages each.
The result is a classic long-tail distribution. And it means that if you're spending equal effort worrying about every document type, you're spreading your attention too thin.
What the digitisation patterns confirm
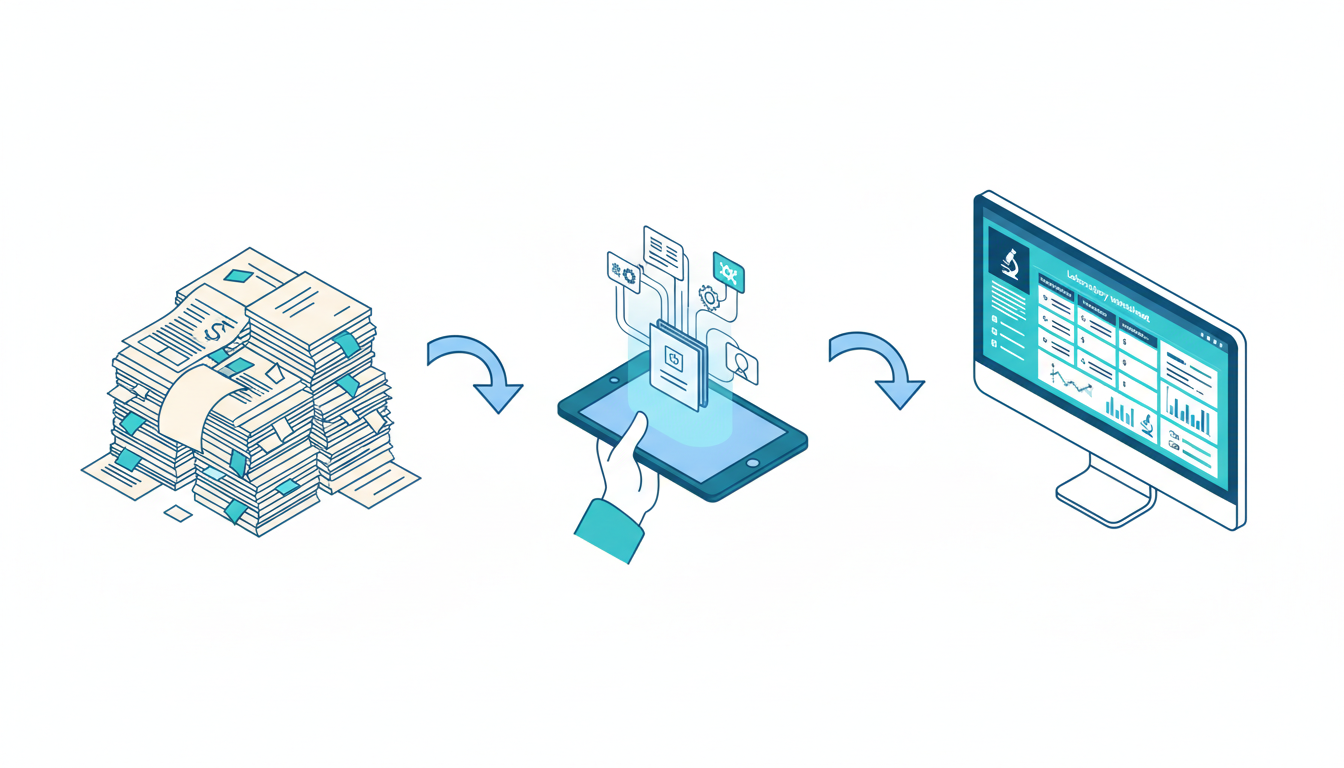
The industry's digitisation sequence mirrors the Pareto distribution: batch records first, then logbooks and SOPs, then everything else.
The way the industry has sequenced its digital investments provides strong corroborating evidence. Electronic batch record (EBR) systems are consistently the first and most common digital investment — precisely because batch records represent the largest paper burden. MasterControl reports clients achieving 90% reduction in paper usage after EBR deployment [1]. EY's analysis showed that Review by Exception can compress a 150-page batch record review down to a 3-page exception report [5]. PCI consolidated 13 paper batch records supporting 120 SKUs into just two digital production records [1].
A 2023 survey by Pharmaceutical Manufacturing found that 67% of companies using EBRs reported 30–60% paper reduction, with 62% listing environmental impact as a top-five driver for adoption — up from 41% in 2020 [8].
The second wave targets logbooks and SOPs. The third wave addresses validation and lab operations.
The industry isn't consciously following a Pareto analysis. But it's arrived at the same conclusion through trial and error: start where the paper is thickest and most frequent.
Your site might look different — and that's fine
The exact percentages will vary depending on your operation. A high-volume oral solid dosage facility will be heavily batch-record-dominated. A contract testing laboratory will see lab worksheets take the top spot. A greenfield site under construction will generate disproportionate validation paper.
But the underlying pattern holds: a small number of document types will account for the majority of your paper. And knowing which ones they are at your site is the first step toward doing something about it.
The takeaway
If you're thinking about reducing paper — whether for cost, efficiency, sustainability, or all three — don't try to boil the ocean. The data points to a clear sequence:
First, tackle batch records. They're 40–50% of your paper all by themselves.
Second, address logbooks. They're another 15–20% hiding in plain sight.
Third, look at lab worksheets and SOPs for the next layer of savings.
Everything else — deviation reports, CAPAs, change controls, calibration records, training records — collectively represents the long tail. Important documents, every one of them. But not where the biggest wins are waiting.
The absence of a formal published Pareto analysis of pharmaceutical paper consumption is itself a gap in the industry literature. Consider this a first attempt at filling it. If your site's experience tells a different story, we'd genuinely love to hear it.
References
[1] Jackson, L. & Hansen, T. (2025). "From Paper to Planet: Revolutionising Environmental Responsibility in Pharma." ONdrugDelivery. Also published at pci.com/resources/electronic-batch-records-pharma-sustainability. Environmental impact calculations derived from Environmental Paper Network Paper Calculator v4.0. MasterControl 90% paper reduction figure from MasterControl Customer Impact Summary & Benchmarking Reports (2022–2024).
[2] ISPE (2023). "Meet the 2023 FOYA Social Impact Category Winner: Takeda SA." Pharmaceutical Engineering. Available at ispe.org. See also: Takeda press release, "Takeda Awarded Top Honors in Social Impact Category for the 2023 ISPE Facility of the Year Awards," 9 May 2023.
[3] Apprentice.io. "Money, Time, Effort, Errors: How Much Is Paper Costing You?" Available at apprentice.io/resources.
[4] Webster, M. (2012). "Bridging the Information Worker Productivity Gap: New Challenges and Opportunities for IT." IDC & Adobe. Original source for the $19,700 per worker per year figure cited by Apprentice.io.
[5] EY (2025). "Electronic Batch Records Improve Pharma Manufacturing." Available at ey.com.
[6] Qualio. Referenced in multiple industry analyses of batch record complexity. Qualio's documentation notes that some batch records comprise thousands of pages with thousands of fields for a single production process.
[7] "The Future of Paper Batch Records in Pharma's Digital Transformation: A Case Study." Pharmaceutical Technology, December 2021. Available at pharmaceutical-technology.com. Details AGC Pharma Chemicals' electronic batch record implementation at its Malgrat de Mar, Spain facility.
[8] Pharmaceutical Manufacturing Industry Survey (2023). Cited in [1]. Reports on EBR adoption rates, paper reduction outcomes, and environmental impact as a driver for digital transformation.